
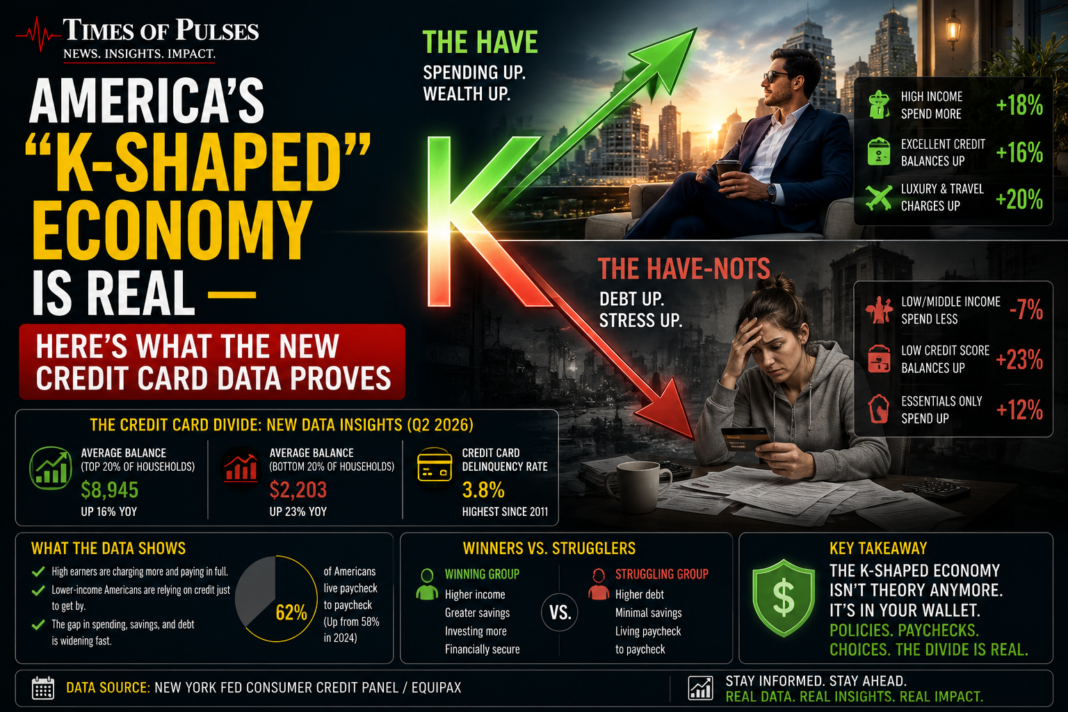
America’s “K-Shaped” Economy Is Real — Here’s What the New Credit Card Data Proves
Some households are thriving right now. Others are falling apart financially. New data released this week from the Federal Reserve Bank of New York confirms both are true at the same time — and the credit card numbers behind it are genuinely stark. Here’s what the K-shaped economy actually means, why credit card debt just hit $1.26 trillion, and where you might fall on that split.
What “K-Shaped Economy” Actually Means
A K-shaped economy describes exactly what it sounds like: picture the letter K, where one line trends upward and the other trends downward from the same starting point. Applied to households, it means higher-income Americans are generally maintaining stability or even improving their financial position, while lower-income households are falling further behind — both happening simultaneously, within the same overall economy.
The New York Fed’s own researchers used this exact framing this week, saying the new credit card data “reflects this K-shaped economy” directly, even as the current U.S. Treasury Secretary has publicly downplayed the idea that this divide still exists.
The Numbers Behind the K-Shaped Economy Right Now
The Federal Reserve Bank of New York’s Quarterly Report on Household Debt and Credit, released this week, shows credit card balances climbed $21 billion in the second quarter to reach $1.26 trillion — reversing a seasonal decline from earlier in the year and nearing last year’s all-time high of $1.28 trillion.
The more revealing number sits inside the delinquency data. The share of credit card balances in “late-stage delinquency” — meaning over 90 days past due — jumped to 12.8% from 7.6% in the second quarter, a level the New York Fed says hasn’t been seen since the Great Recession. Researchers did note this specific figure is a lagging indicator, reflecting past charge-offs still showing up on credit reports, rather than a real-time snapshot.
Why the K-Shaped Economy Shows Up Differently Across Income Levels
This isn’t just credit cards. The New York Fed researchers pointed out that elevated delinquency rates are “more pronounced in the lowest-income areas” across multiple debt types — not just credit cards, but auto loans, home equity lines of credit, and even rising mortgage delinquency rates among homeowners falling behind on payments.
Meanwhile, roughly 60% of the 175 million Americans who have credit cards carry a balance from month to month, according to the New York Fed — a group directly exposed to today’s average credit card rate of around 20%, one of the most expensive ways to borrow money available. That combination — rising balances, elevated rates, and worsening delinquency concentrated among lower-income borrowers — is precisely what defines the downward arm of the K-shaped economy.
The Upward Arm: Why Some Households Are Doing Fine
The other side of the K-shaped economy looks genuinely different. Higher-income households, which skew older and are more likely to own homes, have generally maintained spending levels and stability, benefiting from home equity built up over years and less reliance on high-interest revolving debt to cover everyday expenses. This isn’t a coincidence — it reflects a household’s cumulative financial buffer built before the current stretch of persistent inflation, not just their current income alone.
Why This Divide Matters Beyond Individual Households
Andrew Housser, co-founder of financial services firm Achieve, offered a genuinely important warning about this trend: “the longer this persists, the more the gap widens.” This isn’t a self-correcting pattern — households already falling behind face compounding interest costs that make catching up progressively harder, while households with a financial cushion continue benefiting from stability that reinforces itself.
The New York Fed’s separate Survey of Consumer Expectations, released alongside this report, found fewer consumers now expect their household finances to improve over the next year, with a growing share expecting things to get worse — a sentiment shift that spans the K-shaped divide even if it hits harder on one side.
Where You Might Fall on the K-Shaped Divide
A few honest questions can help you understand your own position:
- Are you carrying a credit card balance month to month? If so, you’re part of the roughly 60% of cardholders directly exposed to today’s elevated interest rates — and as we’ve covered in our reporting on the credit card minimum payment trap, this is exactly the pattern that compounds fastest.
- How does your delinquency status compare to a year ago? If you’re falling further behind rather than catching up, that mirrors the exact pattern New York Fed researchers are flagging as most concerning.
- Do you have a financial buffer — home equity, savings, or an emergency fund — that insulates you from needing to rely on credit cards for everyday expenses? This buffer is largely what separates the two arms of the K.
What You Should Actually Do If You’re on the Downward Side
- Prioritize paying more than the minimum on your highest-interest card first, since 20% average rates mean minimum-only payments barely touch your actual balance
- Build even a small emergency fund alongside debt payoff, so the next unexpected expense doesn’t add directly to your credit card balance — we’ve covered specific strategies in our guide to closing the emergency fund gap
- Contact your card issuer proactively if you’re at risk of falling into late-stage delinquency, since many offer hardship programs that are meaningfully better than letting an account go 90+ days past due
- Track your own numbers against this data, not to compare yourself to others, but to catch a worsening trend before it compounds further
Bottom Line
The K-shaped economy isn’t an abstract economic theory — this week’s New York Fed data shows it playing out in real numbers: $1.26 trillion in collective credit card debt, delinquency rates at levels not seen since the Great Recession, and a divide that researchers say is concentrated specifically among lower-income households. Whether policymakers acknowledge the term or not, the underlying pattern is measurable and, per the Fed’s own researchers, likely to keep widening the longer it goes unaddressed. Understanding which side of that K your own household sits on is the first step toward either protecting your position or actively working to change it.
This article is for informational purposes only and does not constitute financial advice. Consult a licensed financial advisor for guidance specific to your debt situation.